
How to Track User Engagement in WordPress with Google Analytics
Are you properly tracking user engagement on your WordPress site?
User engagement is one of the most important metrics to track because it helps you better understand your audience and what they want. With Google Analytics, you can easily see how people interact with your website.
In this article, we will show you how to track user engagement in WordPress with Google Analytics.

Why Track User Engagement with Google Analytics
Generally, WordPress website owners consider traffic and pageviews to be the most important indicators of their website’s performance. They assume that higher traffic will result in more conversions and sales.
While that is true, you can get even better results by tracking and optimizing user engagement.
User engagement shows you what users do when they arrive on your website. It helps you identify patterns of highly engaged user behavior which leads to more conversions and sales.
For example, you may realize that users visiting a specific page are 10X more likely to make a purchase than any other visitor on your website. You can use this insight to redirect the user’s attention to that page.
Similarly, tracking user engagement can help you see which affiliate links or banner ads your visitors are clicking. Using this data, you’ll be able to optimize your content to get more clicks and boost conversions.
That said, let’s see how you can set up user engagement tracking in WordPress using Google Analytics.
Tracking User Engagement in WordPress using Google Analytics
The best way to set up user engagement tracking in WordPress is by using MonsterInsights. It’s the best Analytics plugin for WordPress and helps you configure Google Analytics without writing code.
MonsterInsights automatically sets up outbound link tracking, form conversion tracking, scroll depth, affiliate link clicks, and other advanced tracking features in Google Analytics out of the box.
It automates the process of pasting different analytics codes and event tracking in WordPress, so you don’t have to deal with the hassle of code and configuration.

For this tutorial, we’ll use the MonsterInsights Pro version because it includes advanced tracking features and more dashboard reports. However, there is also a MonsterInsights Lite version that you can use for free and get started with user engagement tracking.
First, you will need to install and activate the MonsterInsights plugin. If you need help, then please see our guide on how to install a WordPress plugin.
Upon activation, you’ll see the MonsterInsights welcome screen. Go ahead and click the ‘Launch the Wizard’ button.
For more details, please see our guide on how to install Google Analytics in WordPress.
MonsterInsights also helps set up Google Analytics 4 (GA4) in WordPress with its dual tracking feature. This allows you to use Universal Analytics and GA4 together.
Google Analytics 4 is the latest version of Analytics, and it will replace Universal Analytics on July 1, 2023. After this date, you won’t be able to track data in Universal Data. To protect your tracking data, we highly recommend creating a GA4 property.
If you need help, then refer to our tutorial on how to switch to Google Analytics 4 in WordPress.
Now that you have Google Analytics with MonsterInsights ready to go, let’s take a look at what user engagement metrics are best to track and how you can track them.
These aren’t all of the metrics you can track with MonsterInsights and Google Analytics, but they are the most important ones to start with. You can click the links below to jump ahead to any section:
- Tracking Your Most Popular Content
- Tracking How Users Engage with Forms on Your Website
- Tracking Ecommerce Stores Performance in Google Analytics
- Tracking Who’s Clicking on Your AdSense Ads
- Tracking How Far People Scroll Your Website
- Tracking Your Affiliate Links in Google Analytics
- Tracking Bounce Rate in Google Analytics
- Tracking Time Spent on Your Website
- Tracking Pageviews Per Visit with Google Analytics
1. Tracking Your Most Popular Content
The first thing you want to figure out is which posts and pages on your WordPress blog are popular amongst your users. These important pages and posts on your website get the most traffic.
Figuring out what your users like on your site can help you plan a content strategy that expands on what’s already working.
MonsterInsights makes it really simple. You just need to visit the Insights » Reports page in your WordPress admin area and go to the ‘Overview’ report.

After that, you can scroll down to see other reports with different data.
You will find your most popular content under the ‘Top Posts/Pages’ section.

On most websites, 90% of their traffic goes to 10% of the top pages.
Once you find these top pages, you can optimize them for maximum conversions by adding content upgrades or targeted lead magnets on these posts.
2. Tracking How Users Engage with Forms on Your Website
Most websites rely on contact forms to collect user leads and feedback. Sadly, most WordPress contact form plugins don’t give you accurate tracking and conversion data.
MonsterInsights lets you leverage the events tracking feature in Google Analytics to see how many times your forms are viewed and submitted.
To enable form tracking, you need to visit the Insights » Addons page. On this page, you will need to install and activate the Forms addon.

Once you have activated the addon, MonsterInsights will automatically start tracking all forms on your website.
It works with popular contact form plugins like WPForms, Formidable Forms, and others. MonsterInsights also track your website comment form, user registration forms, and more.
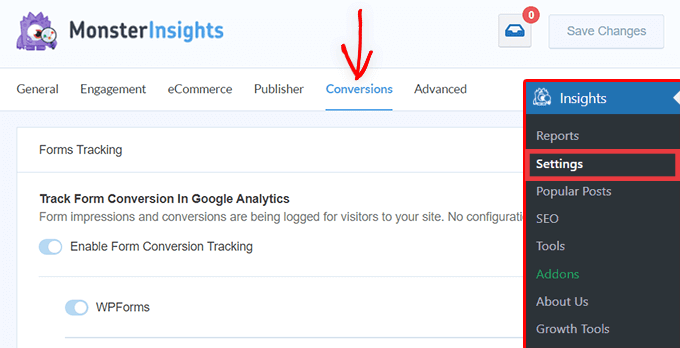
You can check the settings by going to Insights » Settings from your WordPress dashboard and then clicking on the ‘Conversions’ tab.
Next, MonsterInsights shows the performance of your WordPress forms inside your dashboard.
Simply go to Insights » Reports from the admin panel and click on the ‘Forms’ tab. The report shows the number of impressions and conversions, as well as the conversion rate for your different WordPress forms.

For more details, please see our guide on how to track form conversions in WordPress.
3. Tracking Ecommerce Stores Performance in Google Analytics
Google Analytics offers many features specifically for eCommerce websites. However, these features are not turned on by default in Google Analytics, and most users don’t even know that they exist.
Ecommerce tracking lets you see shopping behavior, checkout behavior, product performance, sales performance, and so much more. The best part is that you can combine this data with your overall website traffic to gather better insights.
With MonsterInsights, you can easily set up Enhanced eCommerce on your website without editing code. It seamlessly works with popular plugins like WooCommerce, Easy Digital Downloads, MemberPress, GiveWP, and more.
You can see our guide on how to set up eCommerce tracking in WordPress for more information.
Once you’ve configured tracking, you can head to Insights » Reports from your WordPress admin menu and click on the ‘eCommerce’ report.
Using the report, you can quickly see how your online store is performing. It shows stats like conversion rate, number of transactions, revenue, and average order value.

It also helps identify products that users engage with the most and where they’re coming from.
You can also view the eCommerce report in your Universal Analytics property. Simply visit your Google Analytics account and go to Conversions » Ecommerce page.

Here are a few powerful reports you get by enabling Enhanced eCommerce tracking on your store:
- Shopping Behavior
- Checkout Behavior
- Product Lists Performance
- Sales Performance
On the other hand, you can view the eCommerce reports directly inside in your Google Analytics 4 dashboard by going to Reports » Monetization » Ecommerce purchases.

4. Tracking Who’s Clicking on Your AdSense Ads
Many websites rely on ads to make money online while creating useful content. However, with Google Analytics you can actually see how users interact with ads on your site.
For instance, you’ll be able to track how many clicks each ad is receiving, discover which ads your audience is ignoring, identify the most effective ad placements, and more.
First, you need to integrate Google Analytics into your Google Adsense account.
Head over to your Google Analytics dashboard and click on the ‘Admin’ button located at the bottom left corner of the screen. On the admin page, click on ‘AdSense Links’ under the property column.

Next, you’ll need to select the AdSense property that you want to link with your Analytics property.
To view the right AdSense property, just make sure that you’re signed in with the same Google account you used on both AdSense and Google Analytics.

After that, click on the ‘Link configuration’ option.
Here, you can select the Analytics view in which you want your AdSense data to be available.

After you have configured everything in Google Analytics, you can now see how your AdSense ads are performing.
To view your AdSense reports, go to your Google Analytics account and visit the Behavior » Publisher page.

5. Tracking How Far People Scroll Your Website
When tracking user engagement in WordPress, it’s also important to see how far visitors scroll your website.
It gives you insights into how people use your site and helps improve your page length. Plus, you can use the data to place your AdSense ads, call-to-action buttons, and affiliate links where they’d get the most visibility and conversions.
MonsterInsights automatically enables scroll-depth tracking. You can view the report by going to Insights » Reports from the WordPress admin panel and clicking the ‘Publishers’ tab.

Next, scroll down and view the ‘Scroll’ report.
It will show the average scroll depth percentage. MonsterInsights will trigger events in Google Analytics 4 as users scroll 25%, 50%, 75%, and 100% of a page and compute the percentage from those results.

6. Tracking Your Affiliate Links in Google Analytics
Most marketers use affiliate plugins to manage and cloak affiliate links. This makes your affiliate links look more user-friendly. Here is an example of a cloaked affiliate link:
https://example.com/recommends/product-name/
MonsterInsights allows you to track affiliate links in Google Analytics. This helps you figure out which affiliate products are doing well, which pages are generating more affiliate revenue, and more.
To enable affiliate link tracking, you need to visit the Insights » Settings page. Next, you can switch to the ‘Publisher’ tab and head to the Affiliate Links section.

First, you need to enter the prefix for your link under the Path field, like ‘/refer/’ or ‘/recommend/.’ After that, you need to provide a Label that you would like to use for those links in your Google Analytics reports.
When you’re done, click on the ‘Save Changes’ button to store your settings.
Next, you can view your top affiliate link clicks in MonsterInsights reports. Simply head to the Publishers tab and scroll down to the ‘Top Affiliate Links’ section.

Here, you will see which affiliates are getting the most clicks, so you can promote them more on your site and boost sales.
Additionally, MonsterInsights will also show your Top Outbound Links. These are external links that people click and exit your site. You can use insights from this report to get more backlinks, form partnerships, signup for affiliate programs, and exchange guest posts.
For more detailed instructions, see our guide on how to track outbound links in WordPress.
7. Tracking Bounce Rate in Google Analytics
Bounce rate is the percentage of users who land on your website and decide to leave without going to a second page.
With MonsterInsights, you get to see the overall bounce rate of your website inside the WordPress dashboard. Simply go to Insights » Reports from your WordPress admin menu and click on the ‘Overview’ tab.
Besides that, the plugin also shows the bounce rate for your important pages.
You can go to the Publishers report and view the ‘Top Landing Pages’ section. In the report, you’ll see the bounce rate for different content.

A higher bounce rate indicates that you were unable to convince the user to visit other pages. Users can leave your website by clicking on the back button in their browser, clicking on an outgoing link, or by closing the window.
Every site has a bounce rate. However, higher bounce rates can indicate problems with your website affecting user experience and causing low engagement.
To lower the bounce rate, you can speed up your website, improve internal links, ensure that your content meets the search intent, improve the readability of your articles, show popular posts, and more.
For more tips, you can see our guide on how to increase pageviews and reduce bounce rate in WordPress.
8. Tracking Time Spent on Your Website
Another indicator that shows user engagement is session duration, or the amount of time users spend on your site.
If users are abandoning your site without spending enough time to look at it, then something is wrong and you need to fix it.
In the MonsterInsights Overview report, you can see the average session duration for your website in the past 30 days.
If you’re using Google Analytics 4, then you’ll see a new metric called average engagement time. It tells the average time your webpage was in the focus of a user.
You can view the report by logging into your GA4 account and then head to Reports » Engagement » Overview.

Using the data, you can better understand your user journey. If the engagement time is low, then you can look into issues like fixing slow site speed, debugging any errors, and making your site’s interface user-friendly.
9. Tracking Pageviews Per Visit with Google Analytics
Pageviews Per Visit is another excellent indicator of how engaged your users are. Higher pageviews per session means people are visiting multiple landing pages and articles on your site. This in return helps increase the time users spend on your site and decreases bounce rates.
Universal Analytics will show you the total page views for a given period on the Audience » Overview page. However, to track user engagement you want to see Pageviews per session.

You can also break down page views per session by source and channel.
Simply go to the Acquisition » All Traffic » Channels page.

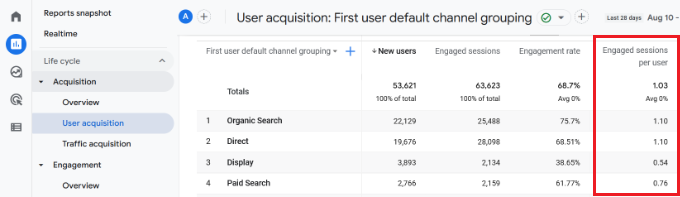
In Google Analytics 4, you can view the sessions per user metric based on different traffic sources and see how many pages users view in a single session.
Just head to Reports » Acquisition » User acquisition from your GA4 property.
This helps you see which traffic channels are converting the best for your website. You can then focus your content marketing efforts on areas that are actually driving results.
We hope this article helped you track user engagement in WordPress with Google Analytics. You may also want to see our ultimate step-by-step WordPress SEO guide and how to create an email newsletter the right way.
If you liked this article, then please subscribe to our YouTube Channel for WordPress video tutorials. You can also find us on Twitter and Facebook.
